
Free letting comparison
Compare short-let and long-let assumptions side by side
Model income, costs and occupancy for two strategies using one consistent property scenario.
This comparison is illustrative and is not a revenue forecast, valuation or investment recommendation.
Enter both scenarios
Add long-let and short-let figures, then run the comparison.
Your Property Details
Fill in both strategies. We'll tell you which wins — and the break-even occupancy you need to make short-let worthwhile.
Moderate short-let demand in National Average
🏠 Long-Let Strategy
= £16,800/yr gross
🌟 Short-Let Strategy
National Average range: £60–£95/night
National Average realistic avg: 58%
03Read the comparison
Comparable basis
Both strategies use the same core property assumptions.
Occupancy sensitivity
Short-let outcomes can change materially with occupancy and stay length.
Operating burden
Management, cleaning, utilities and compliance differ between strategies.
User-provided comparison assumptions
The result uses the rent, rate, occupancy and cost assumptions entered for each strategy.
05Connect the Social Home workflow
Keep the decision connected
Use Social Home to record the next action, connect evidence and monitor the wider portfolio workflow.
Only this tool’s identity is shared. Inputs, addresses, money values and results stay on this page.
Or explore the platform workflow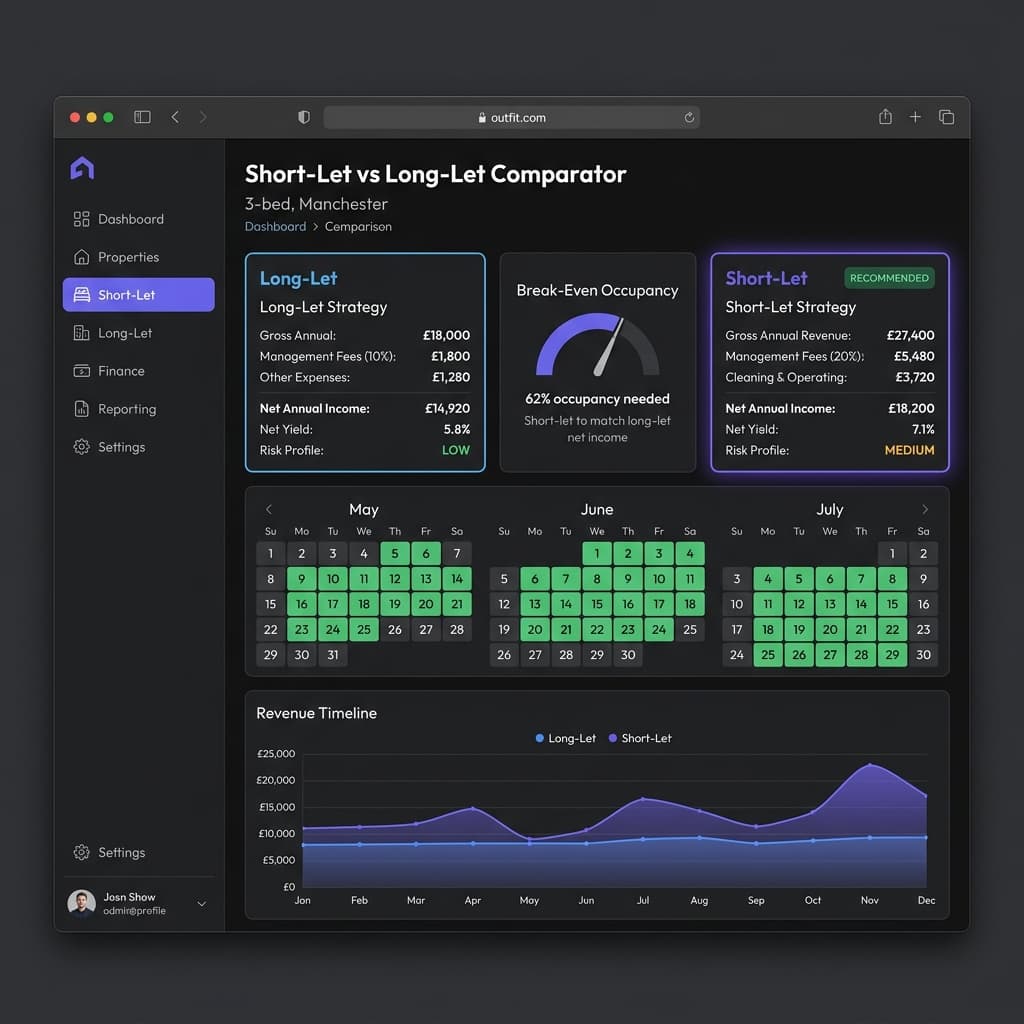
Related tools
Continue the same decision with another focused tool.
Frequently asked questions
Quick context for using this page responsibly.
Does the calculator recommend one strategy?
No. It compares the assumptions entered and cannot account for every local, legal, operational or personal consideration.
Should I verify short-let restrictions separately?
Yes. Confirm lease, mortgage, insurance, planning, licensing and local-authority requirements before operating a short let.